Your support inbox holds more intelligence about customer health than most dashboards ever will. Every frustrated reply, every repeated question about the same broken feature, every billing dispute that drags on for days—these are signals. And if you're not paying attention, they're slipping through your fingers while customers quietly slip out the door.
Key Takeaways:
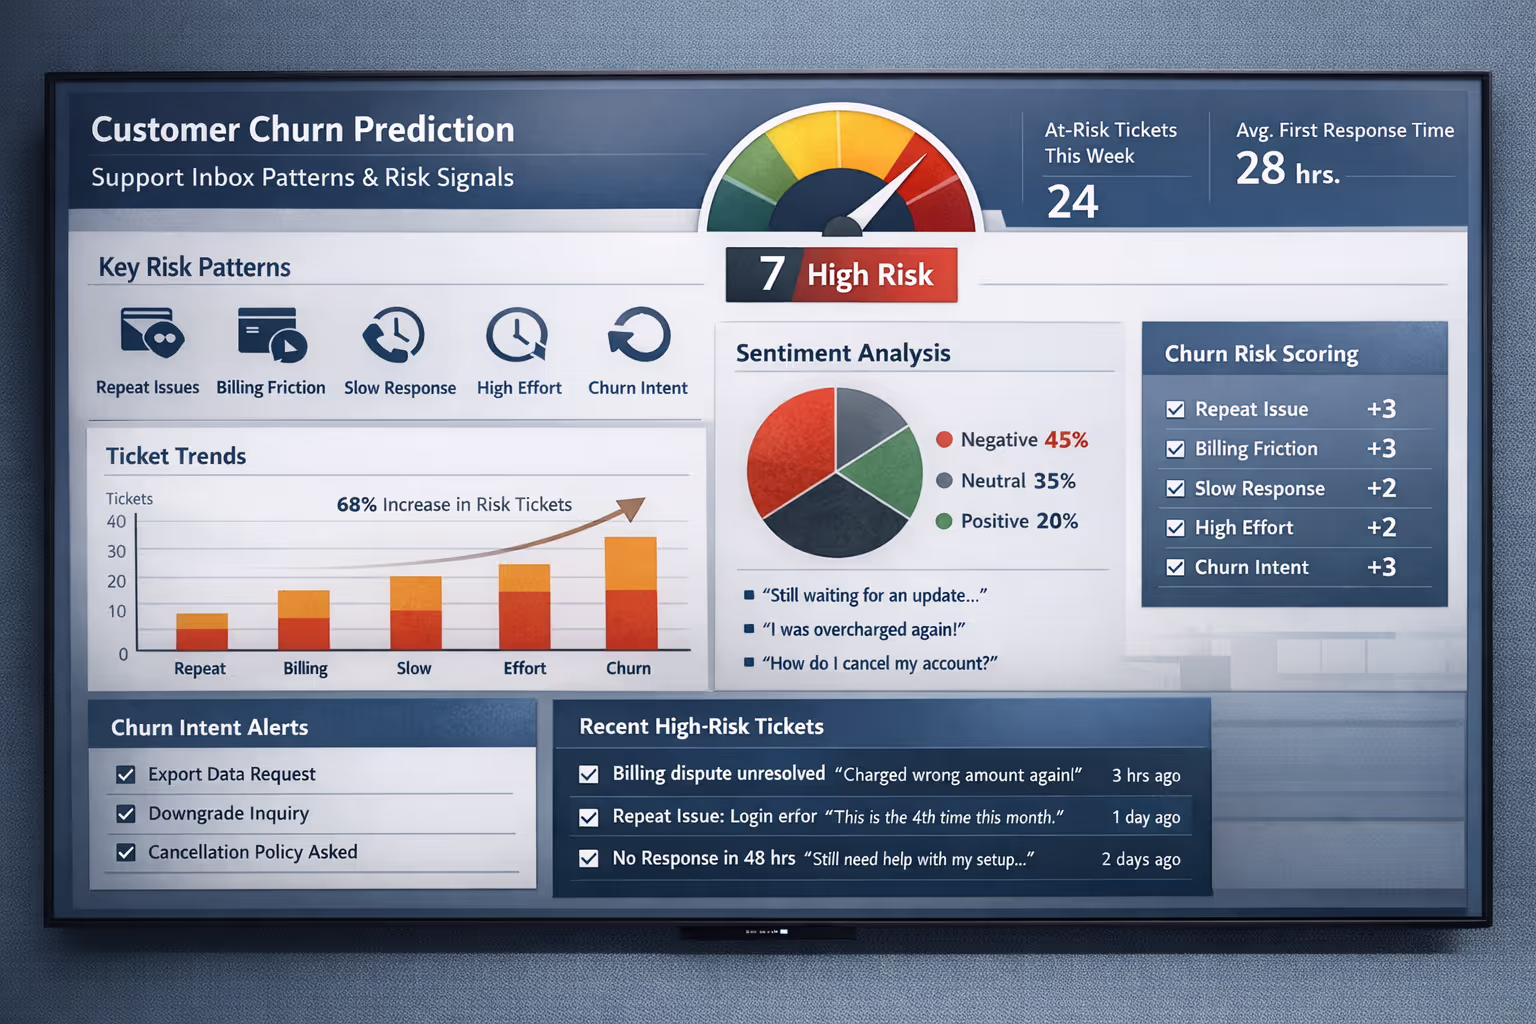
Repeat issues, billing friction, slow responses, escalating effort, and churn-intent questions are the five inbox patterns most predictive of cancellation
You can build a simple churn risk scoring system using your existing helpdesk's tagging features (Zendesk, Intercom, Help Scout, Gorgias, etc.)
Tracking "first response time to eventual churners" often reveals a fixable leak in your retention
A dedicated support team creates the capacity to both spot these signals and act on them before customers leave
For small SaaS and ecommerce teams, churn rarely announces itself with a dramatic cancellation email. It shows up first in ticket patterns, tone shifts, and the third message in a week about an issue you thought was resolved.
You're already sitting on the data. You just need to know how to read it.
How to Predict Customer Churn Using Support Data
Most churn prediction models focus on product usage metrics—login frequency, feature adoption, time-in-app. Those matter. But they miss something critical: the emotional and experiential signals that show up in customer communication long before someone stops logging in.
Research from the Harvard Business Review found that customers who have a complaint handled well are actually more loyal than those who never had a problem at all [1]. The flip side? Poorly handled complaints accelerate churn faster than almost any other factor.
Your support inbox captures what product analytics cannot:
Frustration escalation as issues drag on
Confusion patterns around billing, features, or processes
Trust erosion when promises feel broken
Effort signals when customers work too hard for basic help
For small teams without dedicated customer success software, email conversations are often the richest (and most underutilized) source of retention intelligence.
The Five Churn Risk Patterns Hiding in Your Tickets
Not every complaint signals danger. But certain patterns—especially when they cluster—should trigger immediate attention. Here's what to watch for.

Pattern 1: The Repeat Offender Issue
A customer emails about the same problem twice in 30 days. Then again. Each time, you respond. Each time, they seem satisfied. But the issue keeps resurfacing.
What it signals: Something isn't actually fixed, or your solution isn't sticking. The customer is losing confidence that you can solve their problem permanently.
Real inbox example:
"Hi again—the export feature broke for me again. This is the third time this month. I really need this to work reliably."
Three touchpoints about the same issue within a billing cycle is a red flag. Customers who experience repeat problems tend to churn at significantly higher rates than those with one-time issues, even if each individual interaction is handled well [2].
How to quantify it:
Tag tickets by issue category in your helpdesk (Zendesk, Intercom, Help Scout, and Gorgias all support custom tags or fields)
Track how many customers have 2+ tickets about the same topic within 30 days
That's your "repeat issue cohort"—and they need proactive outreach, not just reactive responses
Pattern 2: Billing Friction That Drags
Billing questions are normal. Billing disputes that require multiple back-and-forth emails? That's friction turning into frustration.
What it signals: The customer feels confused, overcharged, or misled. Even if you resolve it, the experience leaves a mark.
Real inbox example:
"I was charged $79 but I thought I was on the $49 plan. Can you explain? Also, I never got a receipt for last month."
When billing conversations extend beyond two exchanges, or when customers use words like "confused," "unexpected," or "I thought," you're in churn territory. Research from PwC indicates that a significant portion of customers will leave a brand they love after just one bad experience—and billing disputes hit particularly hard because they involve money and trust simultaneously [3].
How to quantify it:
Measure average resolution time for billing-tagged tickets separately from other issues
Track "billing ticket reopens"—cases where a customer responds to a closed billing ticket within 7 days
In Intercom or Zendesk, you can create a saved view filtering for billing tags with multiple replies
Pattern 3: Slow Response Before Silence
This one's subtle but costly. A customer emails with a question. You respond 48 hours later. They don't reply. A month later, they cancel.
What it signals: They needed help when they asked. By the time you answered, they'd either figured it out themselves, found an alternative, or decided you weren't reliable.
Real inbox example: Customer sends a question on Monday. Your reply lands Wednesday afternoon. No response. Two weeks later: "I'd like to cancel my subscription."
Customer expectations around response time have shifted dramatically. Industry benchmarks suggest that most customers expect a response within a few hours for email inquiries, not days [4]. When you miss that window, silence isn't acceptance—it's often abandonment.
How to quantify it:
Calculate your "first response time to eventual churners"
Compare it against customers who renew
If churned customers consistently experienced longer wait times in their final 90 days, you've found a fixable leak
Most helpdesks let you export ticket data with timestamps—cross-reference with your churn list
Pattern 4: The Effort Escalation
The customer starts polite. Then firm. Then frustrated. Then terse. You can literally watch the tone shift across a ticket thread.
What it signals: They're expending too much effort to get basic help. Customer effort is one of the strongest predictors of disloyalty—stronger than delight, according to research on the Customer Effort Score [1].
Real inbox example:
Email 1: "Hi! Quick question about integrations."Email 3: "Following up again—still haven't heard back on this."Email 5: "I've now spent two weeks trying to get a straight answer. Is anyone there?"
How to quantify it:
Track "messages per resolution" as a metric
Tickets requiring 4+ customer replies to resolve should be flagged and reviewed
Consider sentiment analysis if you're using a helpdesk that supports it—Intercom and Zendesk both offer basic sentiment detection
Even simple keyword flagging for "frustrated," "disappointed," or "still waiting" can surface at-risk conversations

Pattern 5: The Cancellation Breadcrumb Trail
Sometimes customers don't complain loudly. They ask quiet questions that hint at exit planning.
What it signals: They're evaluating whether to stay—and gathering information to leave.
Real inbox examples:
"Can I export all my data?"
"How do I downgrade my plan?"
"Is there a way to pause my subscription?"
"What's your cancellation policy?"
These aren't necessarily churn confirmations, but they're churn considerations. Customers actively exploring exit options are often already halfway out the door.
How to quantify it:
Create a "churn intent" tag for questions related to data export, downgrading, pausing, or canceling
Track what percentage of customers who ask these questions actually churn within 60 days
Work backward: what happened in their support history before that question?
In Help Scout or Gorgias, you can set up workflows to auto-tag tickets containing these keywords
Building a Simple Churn Risk Scoring System
You don't need expensive software to start quantifying churn risk from your inbox. Here's a practical framework any small team can implement using the tagging features already built into most helpdesks.
Step 1: Define Your Risk Signals
Based on the patterns above, identify 5-7 specific, taggable signals:
| Signal | Tag | Risk Weight |
| Repeat issue (same topic, 2+ tickets in 30 days) | repeat-issue | High |
| Billing dispute (2+ exchanges) | billing-friction | High |
| First response time > 24 hours | slow-response | Medium |
| 4+ customer messages to resolve | high-effort | Medium |
| Churn-intent question asked | churn-intent | High |
| Negative sentiment language | frustrated-tone | Medium |

Step 2: Assign Point Values
Give each signal a point value based on severity:
High risk signals: 3 points
Medium risk signals: 2 points
Low risk signals: 1 point
Step 3: Set Thresholds
Define what score triggers action:
0-2 points: Normal monitoring
3-4 points: Proactive check-in recommended
5+ points: Immediate outreach required
Step 4: Implement in Your Helpdesk
In Zendesk, use custom fields and triggers to auto-apply tags based on ticket properties. Create a view filtering for customers with multiple risk tags.
In Intercom, use conversation tags and create a segment of users with specific tag combinations. Set up an alert when a user crosses your threshold.
In Help Scout or Gorgias, use saved searches and workflows to surface high-risk conversations automatically.
Step 5: Track and Review Weekly
Pull a report of all customers who hit your thresholds in the past 7 days. This becomes your "at-risk" list for proactive outreach.
The key is consistency. A simple system you actually use beats a sophisticated one that lives in a spreadsheet no one opens.
What to Do When You Spot Churn Risk
Identifying risk is only valuable if you act on it. Here's how to respond to each pattern.
For Repeat Issues
Don't just solve it again. Escalate internally. If a customer has hit the same wall three times, someone on your team needs to investigate the root cause—whether that's a product bug, unclear documentation, or a training gap.
In your response, acknowledge the pattern explicitly:
"I see this is the third time you've run into this, and that's not okay. I've flagged it for our product team and I'm personally going to follow up with you in 48 hours with an update."
For Billing Friction
Resolve first, explain second. If there's any ambiguity, err on the side of the customer. A $30 credit costs far less than a churned account.
Then, fix the upstream problem. Why was the billing confusing? Is your pricing page unclear? Are plan changes not communicated well?
For Slow Response Patterns
You can't un-ring the bell on a late reply, but you can acknowledge it:
"I apologize for the delay in getting back to you—that's not the experience we want you to have."
Then examine your processes. If you're consistently slow, you likely have a capacity problem, not a priority problem. That's where bringing in support help—whether through hiring or partnering with a dedicated team—becomes a retention investment, not just an operational one.
For High-Effort Tickets
When you see effort escalating in real-time, pause the back-and-forth. Pick up the phone (if appropriate) or send a comprehensive reply that anticipates their next three questions.
"I realize this has taken way more of your time than it should. Let me give you everything you need in one place..."
For Churn-Intent Questions
Don't just answer the literal question. Treat it as an invitation to understand their situation:
"I'm happy to walk you through our cancellation process. Before I do—is there something that's not working for you that I might be able to help with?"
You won't save everyone. But you'll save some. And you'll learn what's driving churn for the others.
Turning Churn Data Into Retention Strategy
Individual interventions matter. But the real power comes from aggregating what your inbox teaches you.
Build a Cancellation Reason Log
Every time a customer churns, document why—based on their support history, their final email, or any exit survey data you collect.
Categories might include:
Product didn't fit their needs
Pricing concerns
Unresolved technical issues
Poor support experience
Business closed/changed direction
Switched to competitor
Review this quarterly. If "unresolved technical issues" keeps climbing, that's a product problem. If "poor support experience" appears, that's an operations problem. Data turns vague worry into specific action.
Calculate Your "Support-Influenced Churn Rate"
What percentage of customers who churned had a support interaction in their final 90 days? And of those, how many had a negative experience (high effort, slow response, unresolved issue)?
This metric helps you understand how much of your churn is potentially preventable through better support.
Share Patterns With Product and Leadership
Your inbox sees problems before they show up in aggregate metrics. If three customers email about the same confusing feature this week, that's intelligence your product team needs—not in a quarterly review, but now.
Create a simple weekly summary: "Top 3 issues driving support volume" and "Customers flagged as at-risk." This keeps churn prevention a company-wide priority, not just a support team burden.

When Your Inbox Is Too Full to Listen
Here's the real challenge: most small teams aren't ignoring churn signals on purpose. They're just drowning.
When you're answering tickets until midnight, you don't have time to analyze patterns. When every day feels like triage, proactive outreach to at-risk customers falls off the list. When you're the founder doing support between product meetings, sophisticated tagging systems feel like a luxury you can't afford.
This is where having dedicated support capacity—whether in-house or through a partner—transforms from a cost center into a retention engine.
A support team that handles your day-to-day tickets can:
Consistently tag and categorize every conversation, building the data you need
Flag at-risk customers before they churn, not after
Maintain fast response times that prevent the "slow reply → silence → cancel" pattern
Document cancellation reasons so you can spot trends
Free you to act on churn intelligence instead of just collecting it
The inbox intelligence is only valuable if someone has capacity to both gather it and act on it. For most small teams, that's the bottleneck.
Your Next Step
Your support inbox is talking. The question is whether you're listening—and whether you have the bandwidth to respond.
Start small. Pick one churn signal from this article and track it for the next 30 days. See what you learn about who's at risk and why. Then expand from there.
If you're realizing that the bottleneck isn't knowledge but capacity—that you see the signals but can't consistently act on them—it might be time to bring in human support that specializes in exactly this kind of proactive, pattern-aware customer care.
Ready to turn your support inbox from a churn risk into a retention advantage? Book a call with Evergreen Support to see how a dedicated support team can help you catch churn signals before they become cancellations.
Frequently Asked Questions
How many support tickets indicate a customer is at churn risk?
There's no universal number, but watch for clustering and patterns rather than raw volume. A customer with three tickets about different topics is likely engaged. A customer with three tickets about the same unresolved issue, or multiple billing questions in a single month, shows warning signs. Focus on repeat issues, escalating effort, and churn-intent questions as your primary indicators.
Can small teams realistically track churn signals without dedicated software?
Yes. Most helpdesk tools (Zendesk, Intercom, Help Scout, Gorgias) allow tagging. Create 5-7 tags for your key risk signals, apply them consistently, and pull a weekly report. A spreadsheet tracking "customers with 2+ tags this month" is enough to start. Sophistication can come later—consistency matters more than complexity.
What's the most overlooked churn signal in support inboxes?
Slow response time to eventual churners. Teams often focus on complaint content but miss the timing dimension. Customers who churn frequently experienced longer wait times in their final interactions—not because the team didn't care, but because capacity issues meant delays. Tracking first response time segmented by customer outcome reveals this pattern clearly.
How does outsourcing support help with churn prevention?
A dedicated support team creates the capacity gap most small teams lack. They can maintain consistent response times, systematically tag and track risk signals, flag at-risk accounts for proactive outreach, and document cancellation patterns—all while freeing founders and operators to act on that intelligence rather than just accumulate it.
Should I reach out to every customer who shows a churn signal?
Not necessarily every signal, but definitely patterns. A single slow response probably doesn't warrant outreach. But a customer who has experienced slow responses plus a repeat issue plus a billing question? They deserve a proactive check-in. Use your scoring system to prioritize—act on high-risk combinations, monitor medium-risk customers, and trust that low-risk signals will often resolve naturally.
About Evergreen Support
Evergreen Support is a human-powered customer support agency built specifically for small SaaS and ecommerce businesses. Our US-based team handles your daily inbox, documents support processes, and flags churn risk signals—so you can focus on building your product while your customers get the responsive, personal support they deserve. We've helped founders reclaim their time and improve customer retention through consistent, high-quality email support delivered by real humans who learn your brand inside and out.
Cited Works
[1] Harvard Business Review — "Stop Trying to Delight Your Customers." https://hbr.org/2010/07/stop-trying-to-delight-your-customers
[2] Customer Contact Week Digital — "The True Cost of Repeat Contacts." https://www.customercontactweekdigital.com/
[3] PwC — "Future of Customer Experience Survey." https://www.pwc.com/us/en/services/consulting/library/consumer-intelligence-series/future-of-customer-experience.html
[4] SuperOffice — "Customer Service Benchmark Report." https://www.superoffice.com/blog/customer-service-benchmark-report/