Key Takeaways:
Focus on seven metrics that actually matter for small teams—skip the enterprise dashboards
First response time and consistency often matter more than raw speed
Ticket volume trends reveal product issues before they become crises
Start tracking three core metrics this week; add complexity gradually
You're juggling customer emails between shipping orders, debugging code, and somehow finding time to post on social media. The idea of building a metrics dashboard feels about as realistic as hiring a full analytics team.
But tracking the right customer support metrics doesn't require enterprise software or hours of number-crunching. It requires knowing which numbers actually move the needle for a lean operation—and ignoring everything else.
Most guides on support KPIs assume you have 50+ agents and a six-figure helpdesk budget. That's not helpful when you're a three-person e-commerce operation or a bootstrapped SaaS founder handling support between product sprints.
This guide cuts through that noise. Seven essential metrics that small support teams can actually track, understand, and use to make better decisions—without drowning in dashboards.
Why Customer Support Metrics Matter When You Barely Have Time to Answer Tickets
Three reasons to bother with measurement, even when your inbox is overflowing:
You can't fix what you can't see. If customers keep churning and you don't know your average response time is 72 hours, you're making decisions blind. Even rough data beats gut feelings when you're deciding whether to hire help, invest in tools, or change your process.
Data shows you what's actually urgent. When everything feels like a fire drill, metrics reveal what's genuinely burning. Maybe your response time is fine but your resolution rate is tanking—that's a completely different problem requiring a different solution.
Clear benchmarks keep everyone accountable. Whether you're the only person handling support or you've recently brought on help, having specific targets keeps effort focused on what matters.
The key is choosing metrics that provide actionable insights without creating busywork. Enterprise teams track 30+ KPIs. You need seven.

First Response Time: The Metric That Sets Customer Expectations
First response time (FRT) measures how long customers wait before receiving any reply to their support request. Not a resolution—just an acknowledgment that someone has seen their message.
Why does this matter so much? Speed signals care. A customer who waits 48 hours for a response assumes you don't value their business. A customer who gets a reply within a few hours—even if it's "We're looking into this and will follow up tomorrow"—knows they haven't been forgotten.
What to track: The average time between when a ticket is created and when your team sends the first response.
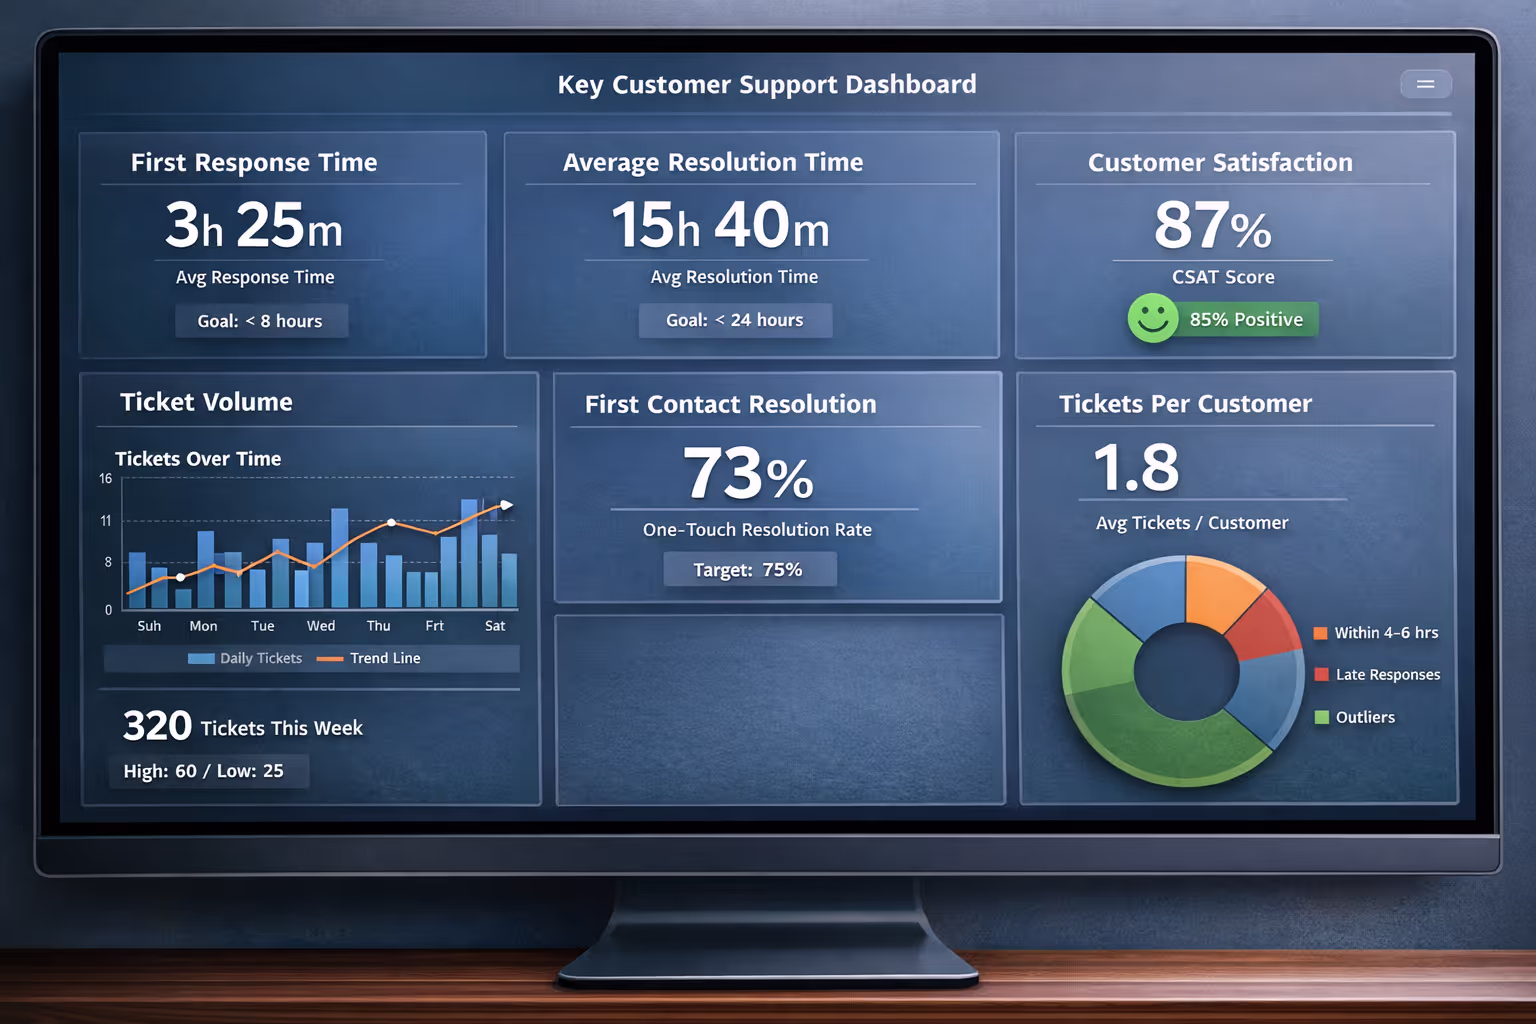
Benchmarks for small teams: Research from SuperOffice found that the average response time across industries hovers around 12 hours, but top performers respond in under an hour [1]. For a lean team without 24/7 coverage, aiming for same-business-day responses (under 8 hours during operating hours) is both realistic and competitive.
How to improve it:
Set up email notifications so new tickets don't sit unnoticed
Create saved replies for common questions to speed up initial responses
Establish clear "office hours" so customers know when to expect replies
Consider whether a simple auto-acknowledgment makes sense for your situation
The goal isn't stressing about responding in 30 seconds. It's ensuring no customer feels ignored.
Average Resolution Time: How Long Problems Actually Take to Solve
While first response time measures acknowledgment, average resolution time (ART) measures how long it takes to actually solve the customer's problem from start to finish.
This metric reveals the complexity of your support workload. If resolution time creeps upward, it could signal product issues creating complicated tickets, knowledge gaps on your team, or processes that create unnecessary back-and-forth.
What to track: The average time from ticket creation to ticket closure.
Benchmarks: This varies dramatically by industry and ticket complexity. E-commerce businesses handling shipping questions might resolve most tickets within 24 hours. SaaS companies dealing with technical bugs might need several days. Rather than chasing an arbitrary benchmark, track your own baseline and work to improve it incrementally.
A word of caution: Don't game this metric by closing tickets prematurely. A ticket marked "resolved" that requires the customer to write back three times isn't actually resolved—it just makes your numbers look better while frustrating your customers.
How to improve it:
Build a knowledge base or internal FAQ so you're not researching the same answers repeatedly
Identify tickets that require escalation and streamline that process
Look for patterns in slow-to-resolve tickets—often a handful of issue types drag down your average
Document solutions as you discover them so the next occurrence goes faster
Customer Satisfaction Score: Direct Feedback on Your Performance
Customer Satisfaction Score (CSAT) measures how happy customers are with specific support interactions. Unlike metrics you calculate from ticket data, CSAT comes directly from customers themselves.
The typical approach: after resolving a ticket, send a brief survey asking customers to rate their experience. Common scales include 1-5 stars, emoji reactions (happy/neutral/sad), or simple thumbs up/thumbs down.
What to track: The percentage of responses that indicate satisfaction. If you're using a 5-point scale, most teams count 4s and 5s as "satisfied."
Benchmarks: According to Zendesk's benchmark data, the average CSAT score across industries hovers around 80% [2]. Scores above 90% indicate excellent service; below 70% suggests significant room for improvement.
Why this matters for small teams: CSAT provides a reality check. You might think support is going well because tickets are getting answered, but if customers rate their experience poorly, something's off. Maybe responses are fast but unhelpful. Maybe tone comes across as curt. CSAT surfaces problems that other metrics miss.
How to implement it simply:
Most helpdesk tools include built-in CSAT surveys
If you're using a shared inbox, consider tools like Simplesat or Nicereply
Keep surveys short—one question gets higher response rates than five
Review negative feedback weekly to spot patterns
Don't obsess over individual scores. One unhappy customer doesn't mean you're failing. Look for trends over time and recurring themes in feedback.

Ticket Volume and Trends: Understanding Your Support Workload
Ticket volume sounds basic, but it's foundational. Knowing how many support requests you receive—and when—helps you plan resources, spot problems, and make smarter decisions about your business.
What to track:
Total tickets per day/week/month
Volume by channel (email, contact form, social media)
Volume by category or tag (shipping, billing, technical issues, etc.)
Spikes and patterns over time
Why trends matter more than totals: A raw number like "150 tickets this month" means nothing without context. But "ticket volume doubled after our last product update, with 60% being questions about the new feature" tells you something actionable—your help documentation probably needs work.
Seasonal and promotional awareness: E-commerce businesses see predictable spikes around holidays and sales events. SaaS companies often see increased volume after releases. Planning for these patterns—whether by clearing your schedule, bringing on temporary help, or improving self-service resources beforehand—prevents the kind of inbox avalanche that damages customer relationships.
Red flags to watch:
Sudden unexplained spikes (might indicate a product bug or website issue)
Gradual increases without corresponding business growth (might indicate UX problems)
High volume in a specific category (might indicate a systemic issue worth fixing at the source)
The goal of tracking ticket volume isn't just survival—it's prevention. Every ticket represents a customer who hit a wall. Understanding why they're writing helps you remove walls.
First Contact Resolution Rate: Solving Problems in One Exchange
First contact resolution (FCR) measures the percentage of tickets resolved in a single response—no back-and-forth required.
High FCR means customers get answers quickly, your team spends less time per ticket, and everyone's happier. Low FCR means customers are stuck in email ping-pong, each exchange adding friction and frustration.
What to track: The percentage of tickets closed after just one response from your team.
Benchmarks: Industry data suggests FCR rates between 70-75% are solid for most support teams [3]. Higher is obviously better, but 100% isn't realistic—some issues genuinely require investigation, clarification, or multiple steps.
Why FCR matters for lean teams: Every unnecessary back-and-forth multiplies your workload. If improving FCR from 50% to 75% means handling the same volume in significantly less time, that's capacity you can redirect toward other priorities (or toward actually taking a day off).
How to improve it:
Anticipate follow-up questions and address them proactively in your first response
Ask clarifying questions all at once rather than one at a time
Create thorough saved replies that cover common edge cases
Ensure your team has the authority to resolve issues without endless escalation
Review tickets requiring multiple exchanges and identify what information could have prevented that
One practical tip: when reviewing reopened tickets or long threads, note what was missing from the initial response. These patterns reveal exactly where your first-contact approach needs strengthening.
Tickets Per Customer: Identifying Product and UX Issues
This underrated metric measures how many support tickets the average customer submits over a given period. It's less about support performance and more about product health.
If customers need to contact support repeatedly, something about your product, documentation, or onboarding isn't working. Support is treating symptoms while the underlying problem goes untreated.
What to track:
Average tickets per customer per month
Percentage of customers who never contact support
Customers who contact support repeatedly (frequent filers)
What the data tells you:
High tickets per customer might indicate confusing UX, missing documentation, or a complex product that needs better onboarding
Certain customer segments contacting support more often could point to gaps in how you serve those segments
Repeat contacts about the same issue suggest your resolution wasn't actually a resolution
How small teams can use this: Rather than just answering tickets, start tracking what questions customers ask most frequently. Are twenty people this month confused about the same feature? That's not a support problem—that's a product feedback loop.
I've seen this play out firsthand: a three-person SaaS team noticed the same onboarding question appearing dozens of times each month. Thirty minutes updating their welcome email sequence eliminated about 40% of those tickets. That's time saved for both them and their customers.
Smart small businesses turn support data into product improvements. Every ticket prevented is time saved for everyone.
Reply Time Consistency: Reliability Matters More Than Speed
Customers care as much about consistent experience as they do about raw speed. A team that always responds within 4-6 hours is often preferable to one that sometimes responds in 10 minutes and sometimes takes 3 days.
Reply time consistency measures the variance in your response times—how predictable your support experience is.
What to track:
Standard deviation of your response times
Percentage of tickets answered within your target window
Outliers (tickets that took dramatically longer than average)
Why this matters: Inconsistency erodes trust. If a customer had a great experience last time (30-minute response) and a terrible one this time (48-hour response), they won't average those together in their head. They'll remember the bad one.
Practical implications for small teams:
Set realistic targets you can hit consistently rather than aspirational ones you'll miss
Communicate expected response times so customers know what to expect
Identify what causes outliers—weekends? Vacations? Certain ticket types?—and address the root causes
Consider whether evening/weekend coverage gaps are creating significant inconsistency
Consistency also helps you plan. If your response time is reliably 4-6 hours, you can confidently tell customers when to expect a reply. If it varies from 1 hour to 3 days, you can't promise anything—and neither can your team.
How to Start Tracking Without Overcomplicating Things
If you're starting from zero, here's a practical approach:
Week 1-2: Establish your baseline
Pick three metrics to focus on first. For most small teams, start with first response time, CSAT, and ticket volume. These are straightforward to track and immediately actionable.
If you don't have helpdesk software, a simple spreadsheet works. Create columns for:
Ticket received timestamp
First response timestamp
Resolution timestamp
Customer rating (if collected)
Category/tag
At the end of each week, calculate your averages. That's your baseline.
Week 3-4: Set realistic targets
Based on your baseline, set improvement goals. Don't aim for perfection—aim for "better than last month." If your average first response time is 18 hours, targeting 12 hours is progress. Targeting 1 hour is fantasy (for now).
Month 2 and beyond: Add complexity gradually
Once your core metrics are stable, layer in first contact resolution, tickets per customer, and consistency tracking. Build the habit before building the dashboard.
Tools that help:
Most helpdesk platforms (Help Scout, Zendesk, Freshdesk, etc.) include built-in reporting for these metrics
Spreadsheets work fine for small volumes—export your ticket data weekly and track trends manually
The key is regular review, not sophisticated software
One common mistake: tracking too many metrics and reviewing none of them. Seven KPIs reviewed weekly beats thirty KPIs ignored in a dashboard.
Turning Metrics Into Action
Data without action is just trivia. Here's how to translate these metrics into actual improvements:
Create a simple weekly review ritual. Spend 15 minutes each Monday reviewing the previous week's numbers. What improved? What got worse? What happened that explains the change?
Identify your biggest constraint. You can't fix everything at once. Which metric, if improved, would have the biggest impact on customer experience and your workload? Focus there first.
Share insights with your team (even if that team is just you). Document what you learn. "Support volume spikes every Monday" is useful information. "Resolution time increases when X happens" helps you prepare.
Connect support data to business decisions. When considering a new product feature, look at related ticket volume. When evaluating a process change, track its impact on resolution time. Support metrics aren't just about support—they're business intelligence.

Next Steps: Implementing These Customer Support KPIs
Customer support metrics don't require enterprise resources. They require choosing the right numbers, tracking them consistently, and turning insights into action.
For lean support teams, these seven KPIs provide a complete picture without creating analysis paralysis:
First response time – Are customers waiting too long for acknowledgment?
Average resolution time – How long do problems actually take to solve?
Customer satisfaction score – Are customers happy with the experience?
Ticket volume and trends – What's driving support demand?
First contact resolution rate – Are you solving problems efficiently?
Tickets per customer – Is your product creating unnecessary support burden?
Reply time consistency – Can customers rely on predictable service?
Start with the basics. Build good habits. Improve incrementally. That's how small teams deliver support that punches above their weight.
Wondering how your support metrics stack up? If you're curious whether your inbox is running as efficiently as it could be—or you're not sure where to start measuring—Evergreen Support offers a free inbox assessment. We'll review your current support setup and identify practical improvements. Book a call to learn more.
Frequently Asked Questions
What's the single most important customer support metric for small businesses?
First response time deserves priority for most small teams. It directly impacts customer perception and is relatively simple to improve through better notification systems and saved replies. Customers who receive prompt acknowledgment are significantly more likely to remain patient while you work toward resolution—even if the fix takes time.
How often should I review customer support metrics?
Weekly reviews work well for most small teams—frequent enough to spot problems early, but not so frequent that you're chasing statistical noise. Monthly or quarterly reviews are better for identifying longer-term trends and making strategic decisions about resources, tools, or process changes.
Can I track these metrics without expensive helpdesk software?
Yes. Basic ticket tracking, response times, and volume can be managed with spreadsheets and email folders. Log received and response timestamps in columns, then calculate averages weekly. However, affordable helpdesk tools (many have free tiers for small teams) automate this tracking and make analysis much easier. The time savings usually justify the cost once you're handling more than a handful of tickets daily.
What's a realistic CSAT score for a small team to aim for?
Anything above 80% puts you in solid territory. Scores above 90% indicate excellent service. If you're below 70%, focus on reviewing negative feedback to identify specific patterns—the path to improvement is usually clearer than you'd expect once you see what's actually frustrating customers.
How do I know if my support workload is too high to handle alone?
Track your ticket volume against your capacity. If you're consistently working evenings and weekends to keep up, if response times are slipping despite your best efforts, or if support is preventing you from working on core business activities, those are signs you've outgrown solo support. Many small businesses find that outsourcing to a fractional support team provides reliable coverage without the commitment of a full-time hire.
About Evergreen Support
Evergreen Support provides US-based, human-powered customer support for small SaaS and e-commerce businesses. Founded by Emma Fletcher and Ellis Annichine, our team helps overwhelmed founders and operators reclaim their time by handling day-to-day email support with the same care and personal touch they would provide themselves. With guaranteed response times and dedicated support specialists for each client, we deliver reliable coverage so you can focus on growing your business.
Works Cited
[1] SuperOffice — "Customer Service Benchmark Report." https://www.superoffice.com/blog/response-times/
[2] Zendesk — "Customer Experience Trends Report." https://www.zendesk.com/blog/customer-experience-trends/
[3] MetricNet — "First Contact Resolution Industry Standard." https://www.metricnet.com/first-contact-resolution/