
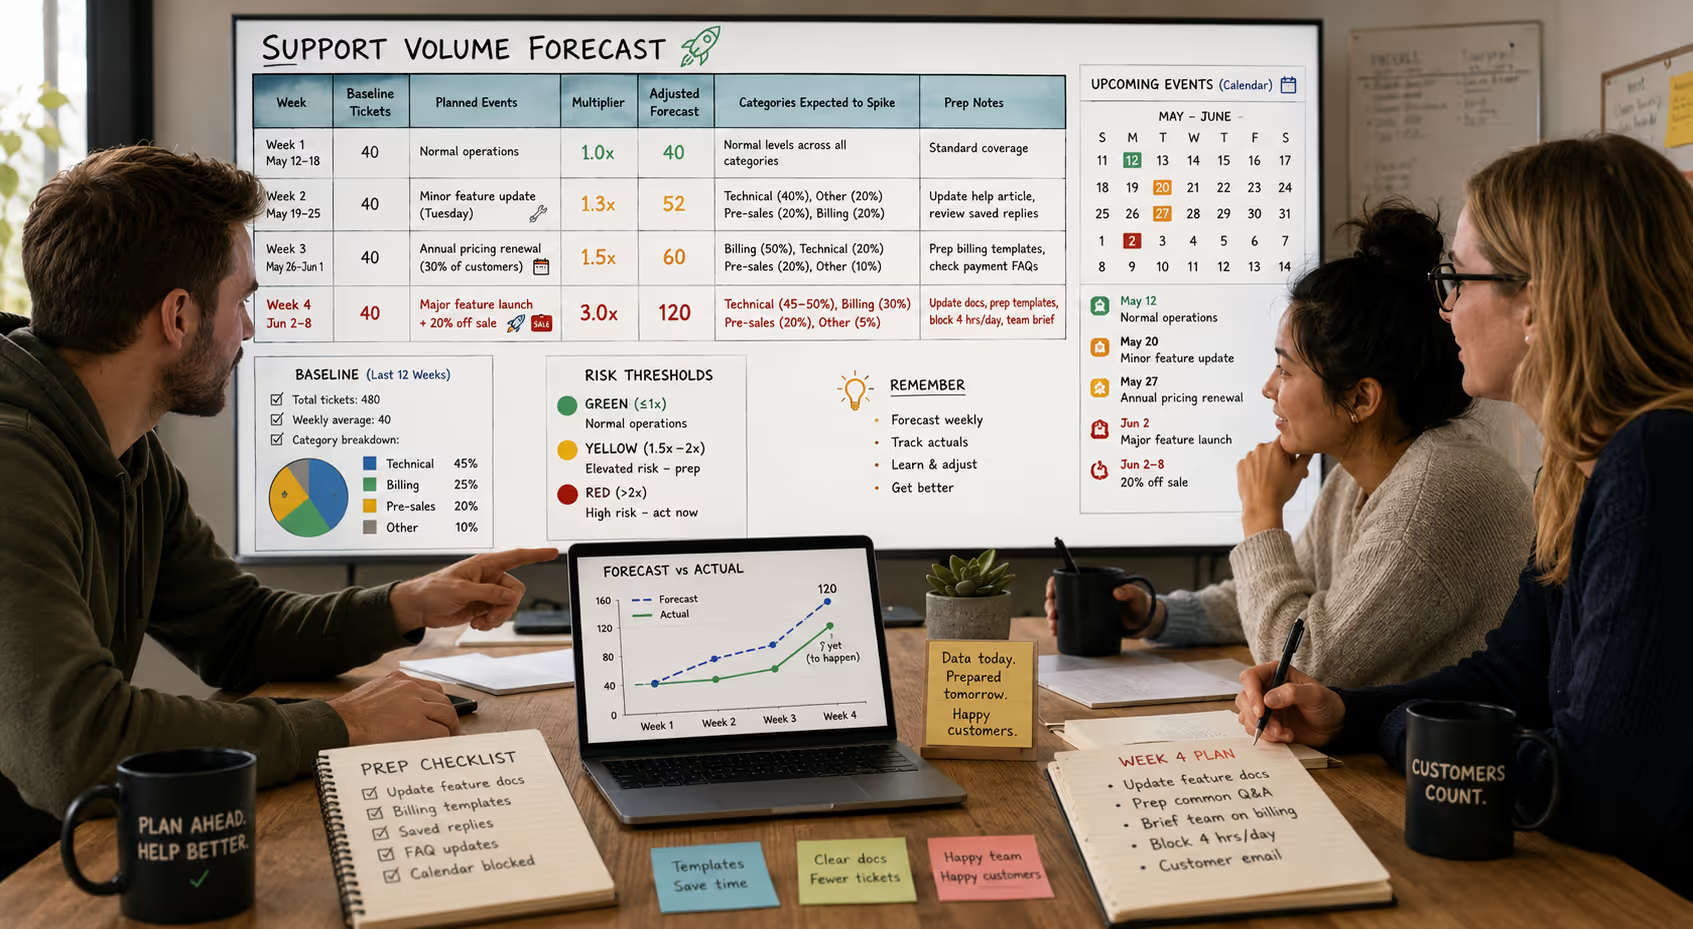
A product launch goes live Tuesday morning. By Wednesday afternoon, your inbox has tripled in size. Response times slip from hours to days. Customers start asking if anyone's actually reading their emails. And you're left wondering why nobody anticipated the surge.
The frustrating part? You could have anticipated it. Support volume forecasting isn't reserved for enterprise teams with dedicated analysts and expensive software. It's a practical discipline that any small SaaS or ecommerce team can adopt using data you already have and a straightforward formula you can run in a spreadsheet.
This guide walks through a founder-friendly forecasting method that helps you predict ticket spikes before they happen. No specialized tools required. Just your historical ticket data, your calendar, and about thirty minutes of focused work.
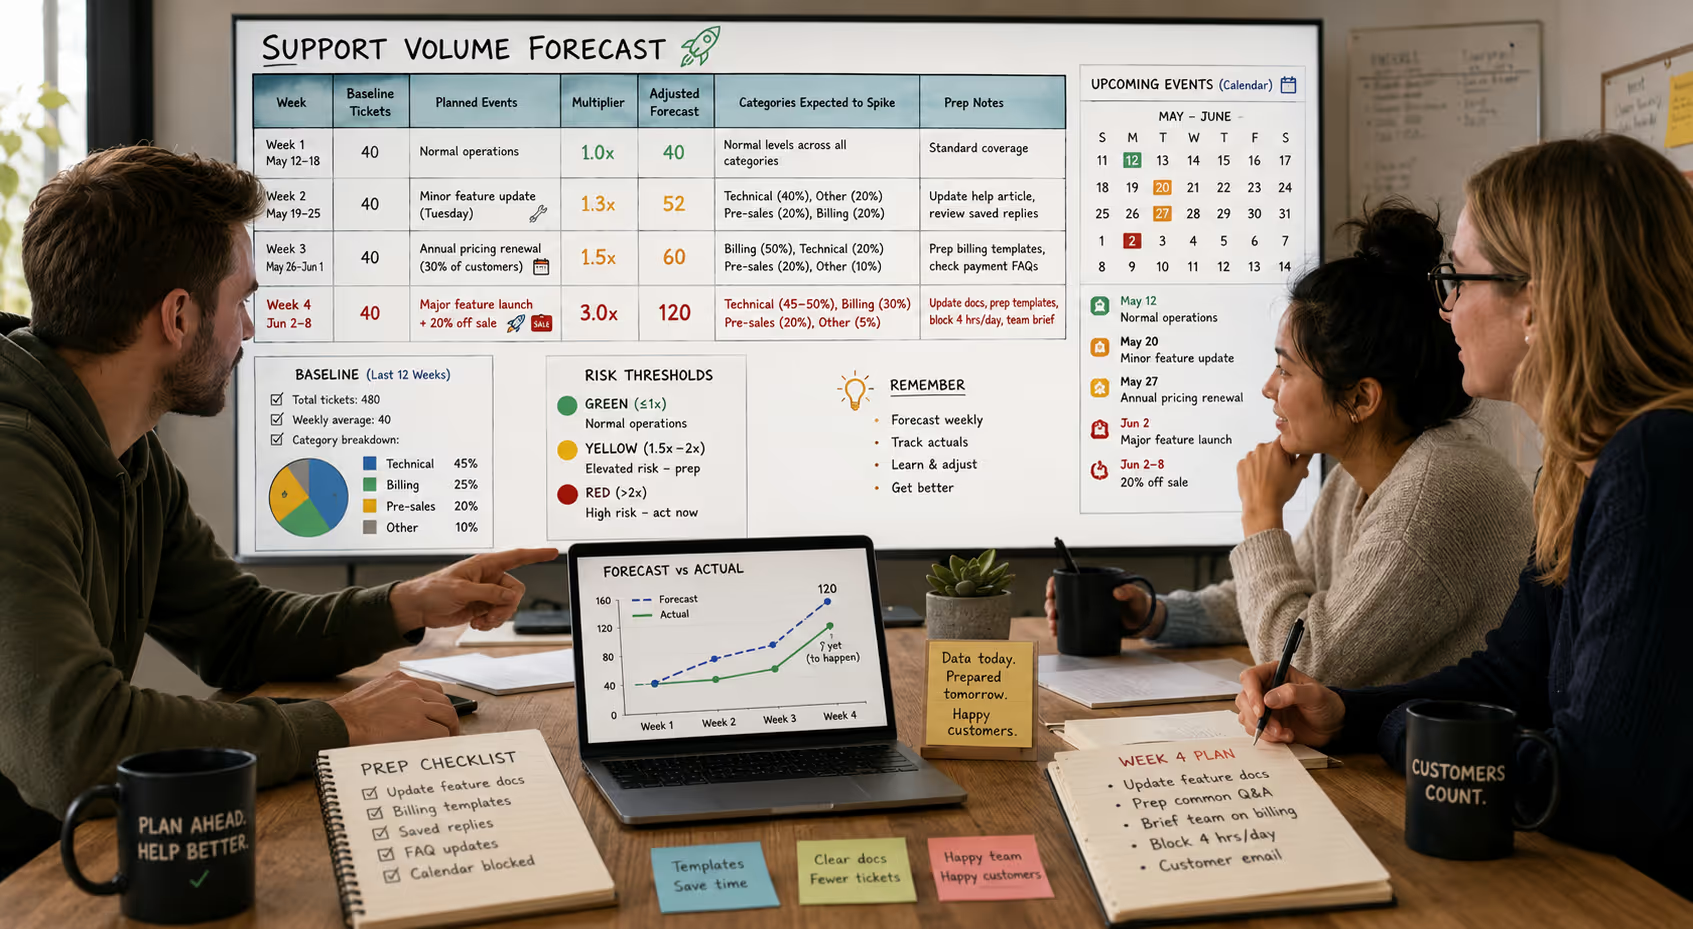
Why Small Teams Need Support Volume Forecasting
Most small business owners treat customer support like weather—something that happens to them rather than something they can anticipate and prepare for. That reactive approach creates real problems.
When volume spikes catch you off guard, response times balloon. According to HubSpot's 2024 State of Customer Service Report, 90% of customers rate an "immediate" response as important when they have a support question [1]. Miss that window repeatedly, and customers start looking elsewhere.
The math isn't complicated. If your baseline is 15 tickets per day and you can handle that comfortably, what happens when a flash sale pushes volume to 45 tickets? Without forecasting, you're scrambling. With forecasting, you've already blocked time, prepped templates, or arranged backup coverage.
For bootstrapped teams especially, the cost of getting this wrong extends beyond customer satisfaction. Every hour you spend firefighting support emergencies is an hour not spent on product development, marketing, or strategic work that actually grows your business.
The Simple Forecasting Formula That Actually Works
Here's a forecasting approach built specifically for small teams with limited historical data.
Step One: Gather Your Baseline Data
Pull your ticket counts from the last 8–12 weeks. You need enough history to spot patterns, but not so much that outdated data skews your predictions.
Where to find this data in common helpdesks:
HelpScout: Navigate to Reports → Conversations. Filter by date range and export to CSV. Use the "Tags" or "Folders" breakdown for category-level data.
Zendesk: Open Zendesk Explore → Create a new query using the Support: Tickets dataset. Add "Ticket Created - Date" and "Ticket Form" (or custom fields) to see volume by category over time.
Freshdesk: Go to Analytics → Helpdesk Reports → Ticket Volume Trends. Export the data and segment by ticket type or group.
Organize your exported data by:
Daily ticket volume
Ticket category (billing, technical, shipping, pre-sales, etc.)
Day of week
This category-level breakdown matters more than total volume. A product launch spikes technical questions. A sale spikes shipping and billing questions. Knowing which categories surge helps you prepare the right resources.
Step Two: Calculate Your Baseline Average
Add up your total tickets over your data period and divide by the number of weeks. That's your weekly baseline.
Example: 360 tickets over 12 weeks = 30 tickets per week baseline
Now break that down by category. If 40% of your tickets are technical, 30% are billing, 20% are shipping, and 10% are pre-sales, you know where your normal volume lives.
Step Three: Identify Your Multipliers
This is where forecasting gets useful. Look back at past events and calculate how much they increased volume above baseline.
Common multiplier events:
| Event Type | Typical Volume Multiplier |
| Minor product update | 1.2x – 1.5x |
| Major feature release | 2x – 3x |
| Promotional sale (20%+ off) | 1.5x – 2.5x |
| Black Friday / major holiday | 3x – 5x |
| Price increase announcement | 1.5x – 2x |
| Outage or service disruption | 3x – 10x |
Your specific multipliers will vary. If you launched a major feature three months ago and tickets doubled that week, your "major release" multiplier is 2x. Use your own data whenever possible.
Step Four: Map Your Promo Calendar and Release Notes
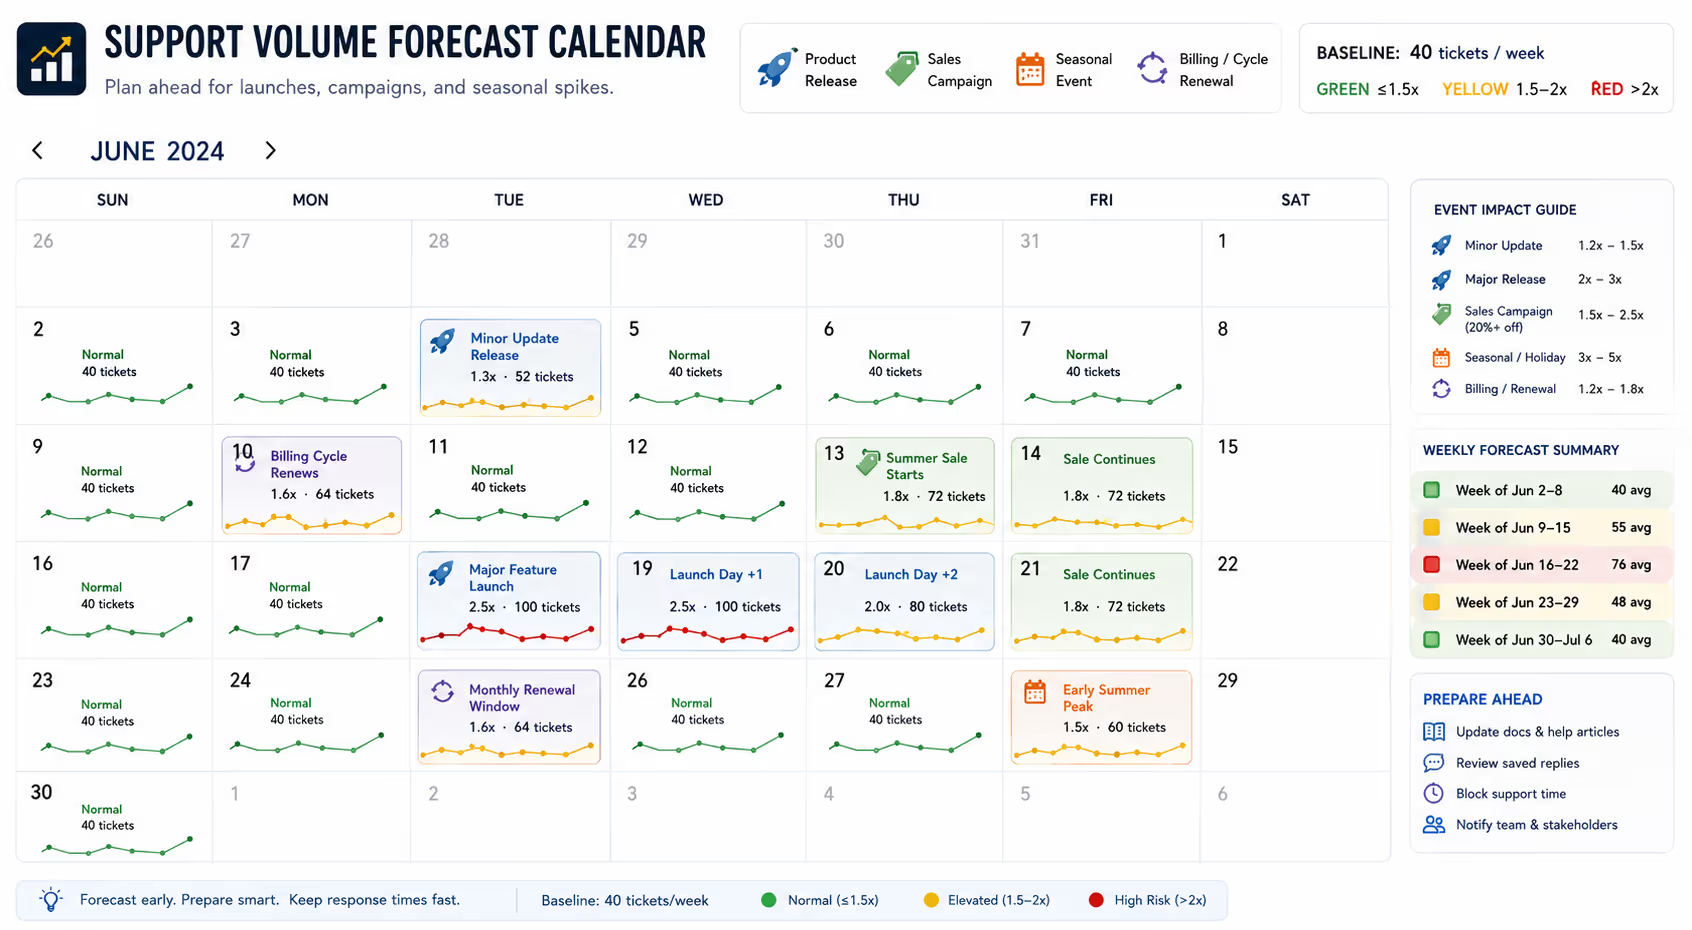
Open your calendar for the next 4–8 weeks. Mark every planned event:
Product launches or updates
Sales or promotional campaigns
Email marketing sends
Seasonal peaks for your industry
Billing cycle dates (subscription renewals often trigger questions)
Now map those events against your multipliers. If you're launching a new feature in week 3 and running a 25% off sale in week 5, you can estimate volume for each week.
Week 3 forecast: 30 baseline tickets × 2.5x (major release) = 75 tickets
Week 5 forecast: 30 baseline tickets × 2x (promotional sale) = 60 tickets
Step Five: Add Category-Level Predictions
Here's where you get genuinely useful forecasts. Different events spike different categories.
A product release primarily increases:
Technical support questions (how does this work?)
Bug reports (this doesn't work)
Feature requests (can it do X?)
A promotional sale primarily increases:
Billing questions (discount not applied, payment issues)
Shipping questions (when will it arrive?)
Pre-sales questions (does it work with Y?)
By predicting which categories will surge, you can prepare targeted resources—saved replies, documentation updates, or escalation procedures—before the spike hits.
Building Your Forecast Spreadsheet
You don't need specialized software for this. A basic spreadsheet handles it perfectly.
Column structure:
Week number or date range
Baseline tickets (your calculated average)
Planned events (list them)
Multiplier for each event
Adjusted forecast (baseline × multiplier)
Category breakdown (which types will spike)
Preparation notes (what you'll do to prepare)
Here's what a completed row looks like:
| Week | Baseline | Events | Multiplier | Forecast | Categories Expected to Spike | Prep Notes |
| Week 4 | 30 | Major feature launch + 20% sale | 3x | 90 | Technical (50%), Billing (25%), Pre-sales (20%) | Update feature docs, prep billing templates, block 4 hrs/day for support |
Update this forecast weekly. As you gather more data, your multipliers become more accurate and your predictions improve.
Setting Backlog Risk Thresholds
Knowing volume is coming only helps if you act on it. Define clear thresholds that trigger preparation actions.
Green zone (normal operations): Volume at or below baseline. Standard coverage handles everything with room to spare.
Yellow zone (elevated risk): Volume 1.5x–2x baseline. Prepare by reviewing saved replies, clearing your calendar of non-essential meetings, and prepping documentation for expected question types.
Red zone (high risk): Volume exceeds 2x baseline. Consider temporary additional coverage, proactive customer communication (FAQs, status updates), and potentially delayed responses for non-urgent tickets with clear communication about timing.
Your specific thresholds depend on your capacity. If you handle 30 tickets per week comfortably with 10 hours of support time, calculate how many tickets per hour you process on average. That tells you exactly when volume will exceed your capacity.
Forecasting for SaaS vs. Ecommerce: Key Differences
While the core method works for both, SaaS and ecommerce businesses face different spike patterns.
SaaS-Specific Considerations
Release cycles drive volume. Map your development roadmap to your forecast. Even minor bug fixes can trigger questions if they change UI or workflows.
Billing cycles create predictable spikes. If most customers renew on the 1st of the month, expect billing questions in the last week of the previous month and first few days of the new month.
Free trial expirations cluster. If you have predictable trial lengths, you can forecast when conversion-related questions will peak.
Churn risk correlates with response time. During high-volume periods, prioritize questions from customers showing churn indicators (failed payments, reduced usage, complaints about specific features).
Ecommerce-Specific Considerations
Seasonal patterns are more pronounced. Most ecommerce businesses see 30–50% of annual volume in Q4. The National Retail Federation's 2023 Holiday Data report found that holiday sales represented roughly 19% of total annual retail sales [2]. Plan coverage months in advance.
Shipping creates the longest tail. Order-related questions continue for weeks after a sale ends. Factor in delivery windows when forecasting how long elevated volume will last.
Promotional timing matters down to the hour. Email sends trigger immediate spikes. A noon promotional email means volume peaks between noon and 6 PM that day.
Return windows create secondary spikes. If you run a holiday sale, expect return-related questions to spike 30–45 days later (whenever your return window closes).
What to Do With Your Forecast
A forecast without a response plan is just a warning you can't act on. Here's how to turn predictions into operational improvements.
Before a Predicted Spike
Update your saved replies. Review templates for the question categories you expect to increase. Update anything outdated and create new templates for anticipated questions.
Prepare proactive communication. Draft FAQ additions, help articles, or email updates that address expected questions before customers ask them.
Clear your calendar. Block time for support during predicted high-volume days. Move meetings that can be rescheduled.
Notify stakeholders. If you're launching a feature, make sure your product team knows support volume will spike and may need their input on technical questions.
During a Spike
Triage ruthlessly. Not all tickets are equal. Billing issues affecting revenue or technical problems blocking core functionality come first.
Use templates aggressively. High-volume periods aren't the time for artisanal, handcrafted responses. Get customers accurate answers quickly.
Track actuals against forecast. Note whether reality matches your prediction. This calibrates future multipliers.
After a Spike
Calculate your actual multiplier. Actual spike volume ÷ baseline = real multiplier. Update your forecasting sheet.
Identify category patterns. Did certain question types dominate? Why?
Document for next time. What worked? What didn't? What will you do differently?
Common Forecasting Mistakes to Avoid
Even simple forecasting has pitfalls. Watch out for these:
Ignoring compounding events. A product launch during a sale isn't 2x + 2x = 4x. It's often higher because the events interact. Customers buying during a sale are new and have questions about the product you just launched.
Forgetting external factors. Industry conferences, competitor outages, viral social posts mentioning your product—all can spike volume unpredictably. Build some buffer into your forecasts.
Over-relying on old data. If your product has changed significantly, historical multipliers may not apply. A feature launch when you had 100 users isn't comparable to a launch when you have 5,000 users.
Not forecasting the tail. Spikes don't end cleanly. A launch might spike volume 3x on day one, but volume often stays elevated for a week or more as follow-up questions arrive.
When Forecasting Reveals a Capacity Problem
Sometimes your forecast shows a clear truth: you don't have enough coverage. If you're predicting 2–3 weeks of volume that exceeds your capacity, you have options.
Reduce volume at the source. Better documentation, clearer product UI, proactive communication—all reduce ticket volume by answering questions before they're asked.
Increase capacity temporarily. Cross-train a team member, delay non-essential work, or bring in outside help.
Set expectations with customers. If response times will be longer than usual, communicate that proactively. Most customers accept slower responses if they know why and when to expect a reply.
Consider ongoing support help. If your forecasts consistently show volume exceeding capacity, the underlying issue isn't forecasting—it's capacity. That's when fractional or outsourced support becomes worth evaluating.
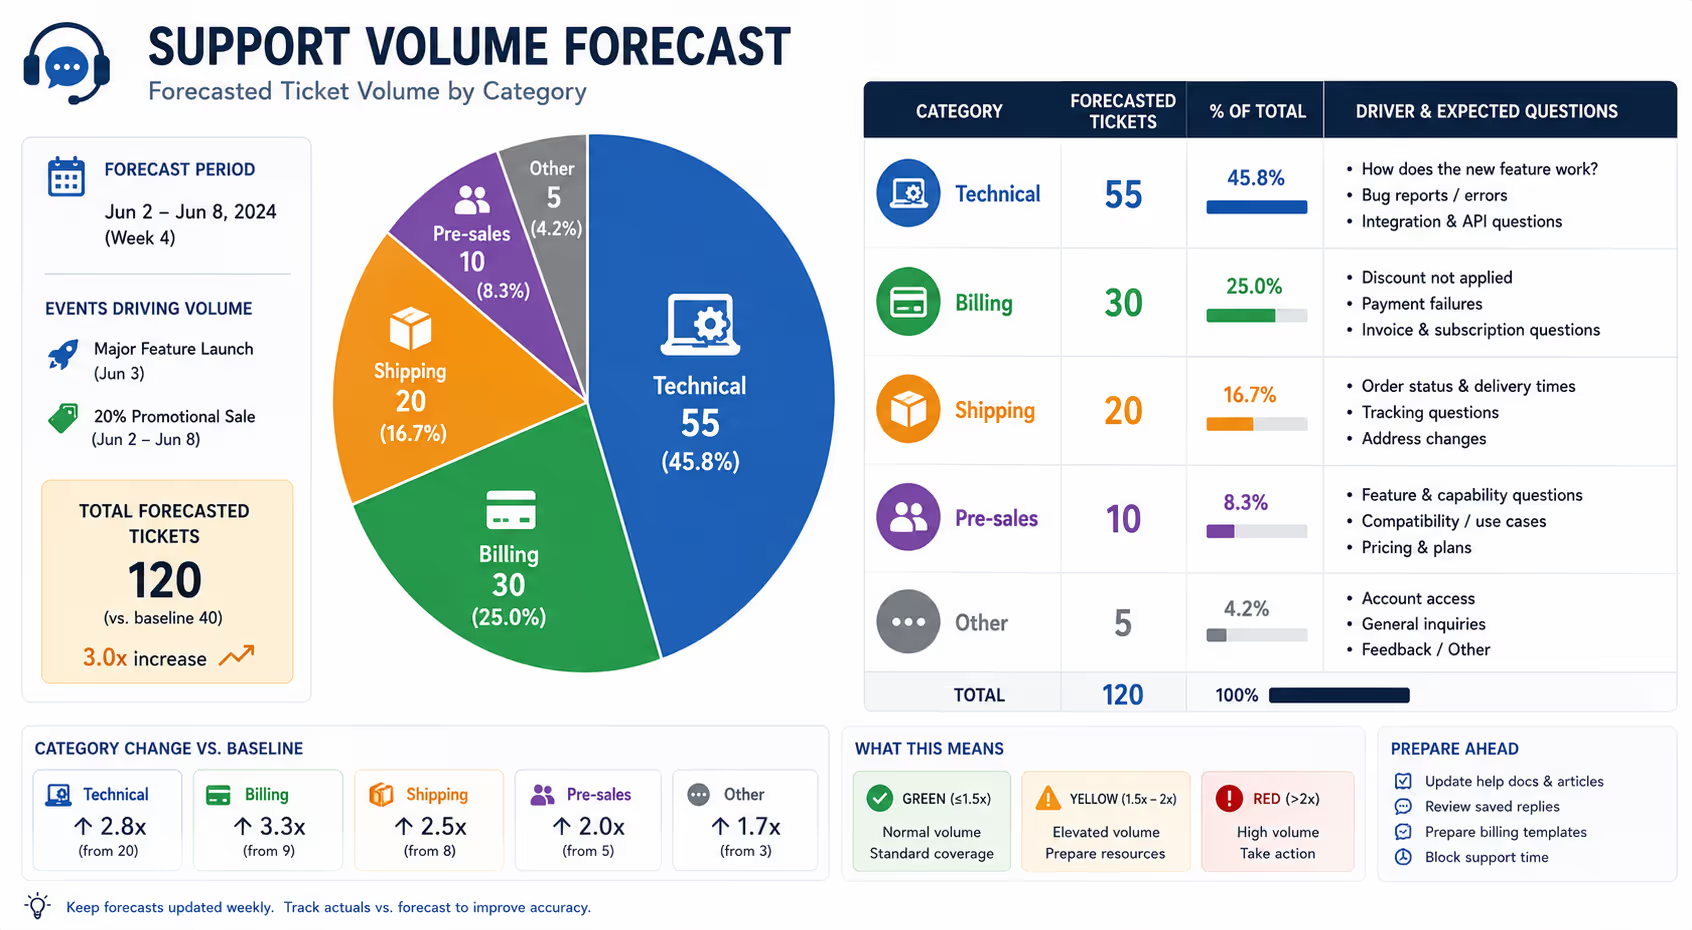
Putting It All Together: A Real Example
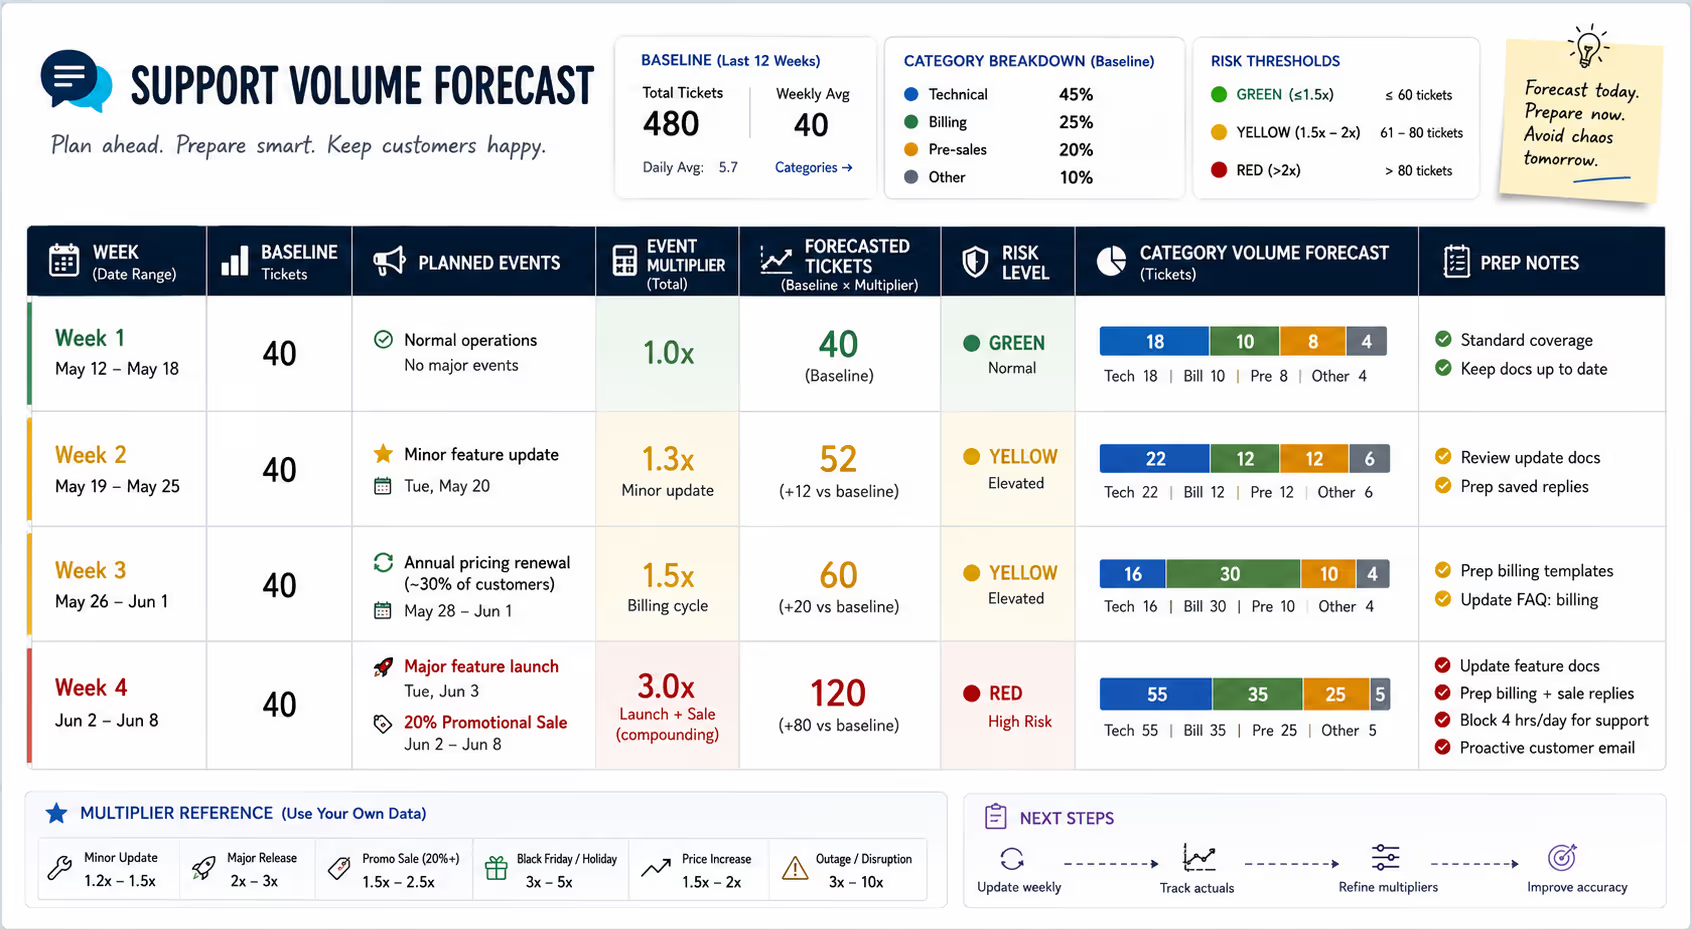
Let's walk through a complete forecast for a hypothetical small SaaS company.
Baseline data (last 12 weeks):
Total tickets: 480
Weekly average: 40 tickets
Category breakdown: Technical (45%), Billing (25%), Pre-sales (20%), Other (10%)
Upcoming 4 weeks:
Week 1: Normal operations
Week 2: Minor feature update (Tuesday)
Week 3: Annual pricing renewal for 30% of customers
Week 4: Major feature launch + 20% promotional discount
Forecasted volume:
Week 1: 40 tickets (baseline)
Week 2: 52 tickets (40 × 1.3 minor update multiplier)
Week 3: 60 tickets (40 × 1.5 billing cycle multiplier)
Week 4: 120 tickets (40 × 3x compounding major launch + sale)
Category predictions for Week 4:
Technical: 55 tickets (major launch = technical questions)
Billing: 35 tickets (sale + new customers)
Pre-sales: 25 tickets (promotional interest)
Other: 5 tickets
Preparation plan for Week 4:
Update feature documentation before launch
Prepare saved replies for common technical questions
Brief team member on billing procedures in case of overflow
Block 4 hours daily for support (up from usual 2)
Send proactive email to existing customers explaining new feature
That's a complete, actionable forecast built from simple data and reasonable assumptions. No expensive tools. No statistical expertise. Just thoughtful planning.
Your Next Step
Start with what you have. Export your last 8–12 weeks of ticket data today. Calculate your baseline. Look at your calendar for the next month. Identify one upcoming event and estimate its multiplier.
That's it. One event. One forecast. See how reality compares. Then expand from there.
If you're consistently forecasting volume that exceeds your capacity—or if building these systems yourself takes time you don't have—that's worth a conversation. Predictable, human-powered support coverage means your inbox stays manageable whether you're launching a feature, running a sale, or taking a well-deserved break.
Ready to get your support forecasting and coverage sorted? Book a call with Evergreen Support to discuss predictable weekday coverage, or request a free Inbox Audit to baseline your current category-level demand.
Frequently Asked Questions
How much historical data do I need to start forecasting?Eight to twelve weeks provides enough pattern recognition without outdated data skewing results. If you have less, start with what you have and refine as you collect more. Even rough forecasts beat no forecasts when you're planning for a known event like a product launch or sale.
What if my business is too new to have reliable multipliers?Use industry benchmarks as starting points. Most SaaS companies see 2–3x volume during major releases. Most ecommerce businesses see 2–4x during promotional sales. Track your actual results and replace benchmarks with your real data as quickly as possible.
Should I forecast daily or weekly?Weekly forecasting works for most small teams and requires less data maintenance. Shift to daily forecasting only when you have specific events with known timing (like an email send at 2 PM) or when weekly variability is significant enough to affect staffing decisions.
How do I handle completely unpredictable spikes like service outages?You can't forecast the unforecastable. What you can do is build response protocols for unexpected volume: prioritization rules, communication templates, escalation procedures. Having these ready means unpredictable events don't become operational chaos.
Does forecasting work if my volume is very low?With very low volume (under 20 tickets per week), percentage-based multipliers become less meaningful. Focus instead on absolute numbers: "This launch might add 10 extra tickets this week." The method still helps you prepare, even if the math looks different.
About Evergreen Support
Evergreen Support provides US-based, human-powered customer support for small SaaS and ecommerce businesses. Founded by Emma Fletcher and Ellis Annichine, the team specializes in helping overwhelmed founders reclaim their time without sacrificing the personal touch their customers expect. With dedicated agents, guaranteed 24-hour weekday response times, and month-to-month flexibility, Evergreen offers a fractional support team that feels like your own—because your customers deserve real humans, not chatbots.
Cited Works
[1] HubSpot — "The State of Customer Service Report (2024)." https://www.hubspot.com/state-of-customer-service/customer-service-statistics
[2] National Retail Federation — "2023 Holiday Data and Trends."
https://nrf.com/research-insights/holiday-data-and-trends/winter-holidays/winter-2023


